> ## Documentation Index
> Fetch the complete documentation index at: https://docs.custral.com/llms.txt
> Use this file to discover all available pages before exploring further.
# Bubble Chart
> Three-dimensional scatter with size as the third axis.
 ## When to use
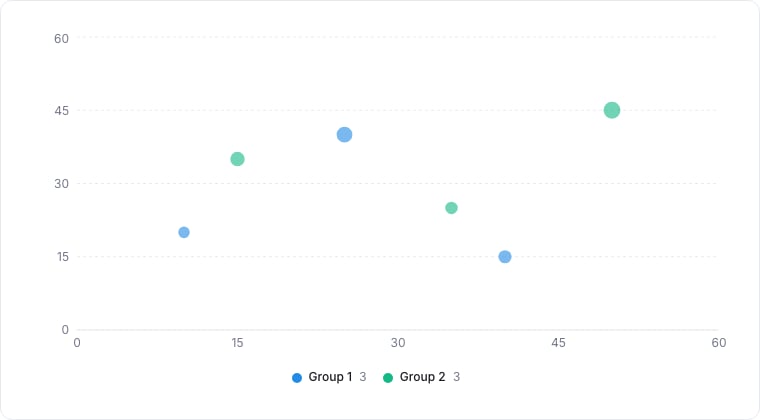
A Bubble chart is a Scatter chart with a third dimension encoded as bubble size. Use it when you have three numeric metrics per record and want to spot outliers and clusters at a glance.
## Required data shape
* **X axis**: numeric property.
* **Y axis**: numeric property.
* **Size**: numeric property used as the bubble area.
## Configuration
| Setting | What it does |
| -------- | ---------------------------------------------------- |
| X-axis | The metric plotted along the horizontal axis. |
| Y-axis | The metric plotted along the vertical axis. |
| Size | The metric that drives each bubble's area. |
| Color by | An optional property whose values color the bubbles. |
## Limitations
* More than \~200 records becomes hard to read.
* Size mapping is by area, not radius, small differences in the underlying value look smaller than they really are.
## Related topics
- [Chart drill-down](/bi/reporting/drill-down.md)
- [Reporting](/bi/reporting/overview.md)
- [Bar Chart](/bi/reporting/charts/bar.md)
- [Line Chart](/bi/reporting/charts/line.md)
- [Composite Chart](/bi/reporting/charts/composite.md)
## When to use
A Bubble chart is a Scatter chart with a third dimension encoded as bubble size. Use it when you have three numeric metrics per record and want to spot outliers and clusters at a glance.
## Required data shape
* **X axis**: numeric property.
* **Y axis**: numeric property.
* **Size**: numeric property used as the bubble area.
## Configuration
| Setting | What it does |
| -------- | ---------------------------------------------------- |
| X-axis | The metric plotted along the horizontal axis. |
| Y-axis | The metric plotted along the vertical axis. |
| Size | The metric that drives each bubble's area. |
| Color by | An optional property whose values color the bubbles. |
## Limitations
* More than \~200 records becomes hard to read.
* Size mapping is by area, not radius, small differences in the underlying value look smaller than they really are.
## Related topics
- [Chart drill-down](/bi/reporting/drill-down.md)
- [Reporting](/bi/reporting/overview.md)
- [Bar Chart](/bi/reporting/charts/bar.md)
- [Line Chart](/bi/reporting/charts/line.md)
- [Composite Chart](/bi/reporting/charts/composite.md)