> ## Documentation Index
> Fetch the complete documentation index at: https://docs.custral.com/llms.txt
> Use this file to discover all available pages before exploring further.
# Composite Chart
> Mixed bar / line / area on a shared axis.
 ## When to use
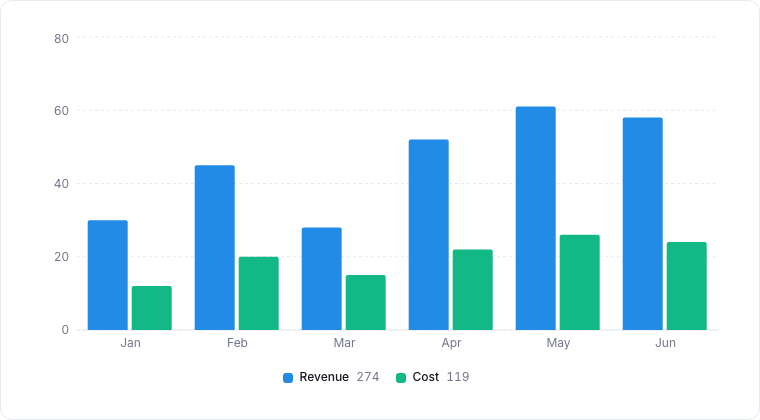
Composite charts overlay multiple series of different chart types on a shared x axis. Use them when you want to show a primary metric (typically as a bar) and a secondary related metric (typically as a line), for example, deal count and conversion rate over time.
## Required data shape
* **X axis**: shared by all series.
* **Series**: one or more series, each with its own type (`bar`, `line`, `area`) and y property.
## Configuration
| Setting | What it does |
| ------- | ------------------------------------------------------------------------------------------------ |
| X-axis | The property shared by every series along the horizontal axis. |
| Series | One or more value series to plot, each with its own type (bar, line, or area), label, and color. |
## Limitations
* Two series is the sweet spot; three is the upper limit for legibility.
* Pick differing scales carefully. If the secondary metric is much smaller than the primary, use a dual-axis view.
## Related topics
- [Funnel Chart](/bi/reporting/charts/funnel.md)
- [Line Chart](/bi/reporting/charts/line.md)
- [Chart drill-down](/bi/reporting/drill-down.md)
- [Reporting](/bi/reporting/overview.md)
- [Address](/data/properties/text/address.md)
## When to use
Composite charts overlay multiple series of different chart types on a shared x axis. Use them when you want to show a primary metric (typically as a bar) and a secondary related metric (typically as a line), for example, deal count and conversion rate over time.
## Required data shape
* **X axis**: shared by all series.
* **Series**: one or more series, each with its own type (`bar`, `line`, `area`) and y property.
## Configuration
| Setting | What it does |
| ------- | ------------------------------------------------------------------------------------------------ |
| X-axis | The property shared by every series along the horizontal axis. |
| Series | One or more value series to plot, each with its own type (bar, line, or area), label, and color. |
## Limitations
* Two series is the sweet spot; three is the upper limit for legibility.
* Pick differing scales carefully. If the secondary metric is much smaller than the primary, use a dual-axis view.
## Related topics
- [Funnel Chart](/bi/reporting/charts/funnel.md)
- [Line Chart](/bi/reporting/charts/line.md)
- [Chart drill-down](/bi/reporting/drill-down.md)
- [Reporting](/bi/reporting/overview.md)
- [Address](/data/properties/text/address.md)