> ## Documentation Index
> Fetch the complete documentation index at: https://docs.custral.com/llms.txt
> Use this file to discover all available pages before exploring further.
# Funnel Chart
> Conversion through ordered stages.
 ## When to use
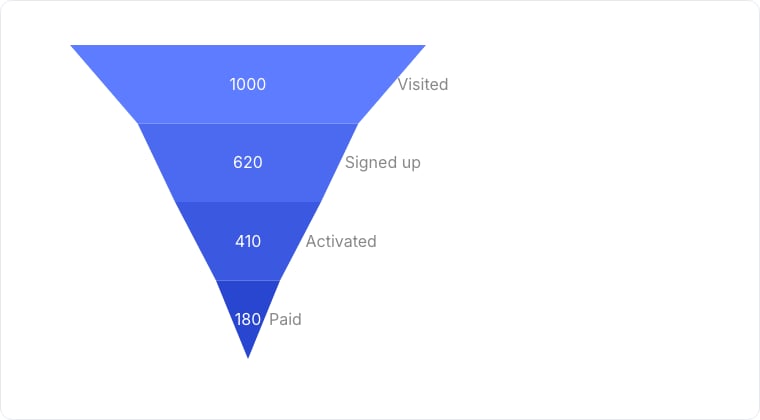
Funnel charts are purpose-built for conversion analysis: how many records made it through stage 1, then stage 2, etc. Pick them when the stages have a known order and you care about the ratio between adjacent stages.
## Required data shape
* **Stages**: a Status property whose options carry an explicit order.
* **Value (optional)**: numeric property aggregated per stage; defaults to record count.
## Configuration
| Setting | What it does |
| ----------- | ------------------------------------------------------------------- |
| Stages | The status property whose ordered options define the funnel stages. |
| Value | The numeric value aggregated per stage. Defaults to a record count. |
| Aggregation | How values roll up: Count or Sum. |
## Limitations
* Funnel only counts the records currently in each stage; it does not show throughput over time. For throughput, pair with a Composite chart.
* Records that skip stages are still counted in their current stage.
## Related topics
- [Build a sales pipeline](/recipes/sales-pipeline.md)
- [Chart drill-down](/bi/reporting/drill-down.md)
- [Business Intelligence](/bi/overview.md)
- [BI Best Practices](/bi/best-practices.md)
- [Reporting](/bi/reporting/overview.md)
## When to use
Funnel charts are purpose-built for conversion analysis: how many records made it through stage 1, then stage 2, etc. Pick them when the stages have a known order and you care about the ratio between adjacent stages.
## Required data shape
* **Stages**: a Status property whose options carry an explicit order.
* **Value (optional)**: numeric property aggregated per stage; defaults to record count.
## Configuration
| Setting | What it does |
| ----------- | ------------------------------------------------------------------- |
| Stages | The status property whose ordered options define the funnel stages. |
| Value | The numeric value aggregated per stage. Defaults to a record count. |
| Aggregation | How values roll up: Count or Sum. |
## Limitations
* Funnel only counts the records currently in each stage; it does not show throughput over time. For throughput, pair with a Composite chart.
* Records that skip stages are still counted in their current stage.
## Related topics
- [Build a sales pipeline](/recipes/sales-pipeline.md)
- [Chart drill-down](/bi/reporting/drill-down.md)
- [Business Intelligence](/bi/overview.md)
- [BI Best Practices](/bi/best-practices.md)
- [Reporting](/bi/reporting/overview.md)