> ## Documentation Index
> Fetch the complete documentation index at: https://docs.custral.com/llms.txt
> Use this file to discover all available pages before exploring further.
# Heatmap
> Density across two categorical axes.
 ## When to use
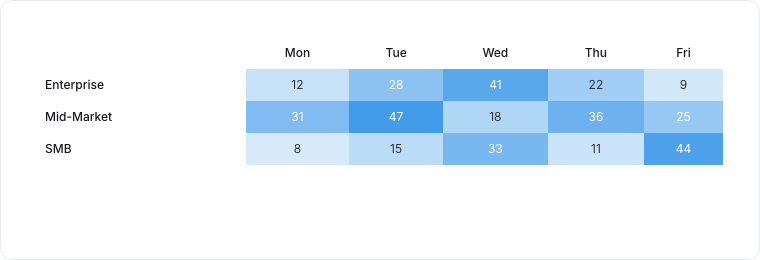
Heatmaps reveal patterns across two categorical dimensions: hour-of-day vs day-of-week, channel vs disposition, sales rep vs deal stage. Color intensity encodes the value at each intersection.
## Required data shape
* **Rows**: a categorical property.
* **Columns**: a second categorical property.
* **Value (optional)**: numeric property aggregated per cell; defaults to count.
## Configuration
| Setting | What it does |
| ----------- | ------------------------------------------------------------------ |
| Rows | The property whose values form the row axis. |
| Columns | The property whose values form the column axis. |
| Value | The numeric value aggregated per cell. Defaults to a record count. |
| Aggregation | How values roll up: Count, Sum, or Average. |
## Limitations
* Best with bounded axes (24 hours, 7 days). Open-ended axes (record id) are not useful.
* Color scale defaults to linear; for highly skewed data, switch to log.
## Related topics
- [Business Intelligence](/bi/overview.md)
- [Chart drill-down](/bi/reporting/drill-down.md)
- [Reporting](/bi/reporting/overview.md)
- [Blocks](/blocks/overview.md)
- [Assemble a support inbox](/recipes/support-inbox.md)
## When to use
Heatmaps reveal patterns across two categorical dimensions: hour-of-day vs day-of-week, channel vs disposition, sales rep vs deal stage. Color intensity encodes the value at each intersection.
## Required data shape
* **Rows**: a categorical property.
* **Columns**: a second categorical property.
* **Value (optional)**: numeric property aggregated per cell; defaults to count.
## Configuration
| Setting | What it does |
| ----------- | ------------------------------------------------------------------ |
| Rows | The property whose values form the row axis. |
| Columns | The property whose values form the column axis. |
| Value | The numeric value aggregated per cell. Defaults to a record count. |
| Aggregation | How values roll up: Count, Sum, or Average. |
## Limitations
* Best with bounded axes (24 hours, 7 days). Open-ended axes (record id) are not useful.
* Color scale defaults to linear; for highly skewed data, switch to log.
## Related topics
- [Business Intelligence](/bi/overview.md)
- [Chart drill-down](/bi/reporting/drill-down.md)
- [Reporting](/bi/reporting/overview.md)
- [Blocks](/blocks/overview.md)
- [Assemble a support inbox](/recipes/support-inbox.md)