> ## Documentation Index
> Fetch the complete documentation index at: https://docs.custral.com/llms.txt
> Use this file to discover all available pages before exploring further.
# Customer Lifecycle
> Conversion and time in each stage, across the whole journey.
 ## When to use
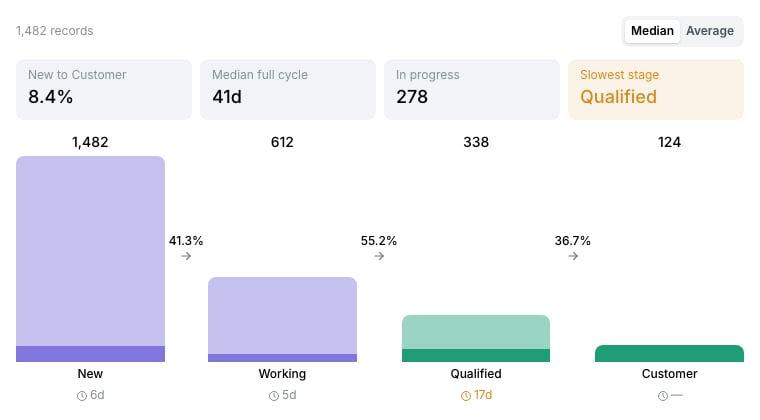
A lifecycle chart answers three questions about one journey at once: how many records **reached** each stage, what share **converted** to the next one, and how long they **sat** in each. Use it for a sales pipeline, an onboarding path, a support queue, or a customer lifecycle — anywhere the stages have an order and you want to know where things stall.
It differs from a [Funnel](/bi/reporting/charts/funnel) in what it counts. A funnel counts the records sitting in each stage **right now**. A lifecycle chart reads each record's stage history, so a record that has moved on to Won still counts as having passed through Demo — which is what makes a conversion rate and a time-in-stage possible.
## Required data shape
* **Stage**: a Select or Status property whose options are in the order records move through them. The chart reads the options' own order.
* **History**: nothing to set up. Every stage change is recorded automatically from the moment the property exists.
## Configuration
| Setting | What it does |
| -------------- | -------------------------------------------------------------------------------------------------------------- |
| Object | The records whose journey you are measuring. |
| Stage property | The Select or Status property whose options are the stages. |
| Entered in | Which records to count, by when they first entered the journey: the last 30, 90, 180 or 365 days, or all time. |
## How to read it
* **The number above each bar** is how many records reached that stage, including any that skipped it on the way past. Because of that, reach never increases from one stage to the next and a conversion rate can never exceed 100%.
* **The darker foot of each bar** is how many records are sitting in that stage now.
* **The percentage between two bars** is the share of the left stage's records that went on to reach the right one.
* **The clock under each stage** is the time records spent there, counting only stays that have ended. Switch between **Median** and **Average** in the top right; median is the better default, since one abandoned record can drag an average a long way.
* **Slowest stage** names the non-final stage with the longest median stay. It is the first place to look when the full cycle is longer than you want.
* **Click any bar** to open the records sitting in that stage.
## Exit stages
A stage whose name reads as an exit — **Lost**, **Churned**, **Disqualified**, **Cancelled**, **Rejected**, **Dead** — is not drawn as a stage of its own. A record that ends there simply stops at the last real stage it reached, which lowers the conversion out of that stage.
This is what stops a pipeline ending "… Won, Lost" from counting every lost deal as having passed through Won.
## Limitations
* **It starts when stage history does.** Records that stopped moving before the stage property existed have no history to read, so an older workspace's earliest records are absent from the time and conversion figures.
* **Time in stage ignores records that are still there.** A record that has sat in Proposal for ninety days and not moved contributes nothing to Proposal's time until it does. The count of records in that stage still shows it.
* **A filtered chart reads at most 10,000 matching records.** Unfiltered, there is no cap.
* **It needs an ordered property.** The stages are drawn in the option order of the property itself, so reordering the options reorders the chart.
## Troubleshooting
| Symptom | Likely cause | What to check |
| ------------------------------------------------------------------------- | ----------------------------------------------- | ----------------------------------------------------------------------------------------------------------------------------------------- |
| "Pick a status or select property to see its stages." | No stage property is set | Open the block's settings and choose a Select or Status property. |
| A stage shows a dash instead of a time | No record has finished a stay there yet | Expected on a final stage, and on any stage whose records are all still in it. |
| Conversion looks too high between two stages | Records are skipping the stage in between | Expected — a skipped stage still counts as reached, so the journey stays honest. Check the stage order on the property if it looks wrong. |
| A Lost or Churned stage is missing | It is treated as an exit | Expected. It lowers conversion out of the previous stage instead of being drawn. |
| The chart is empty with records in view | No record entered the journey inside the window | Widen **Entered in**, or set it to All time. |
| Numbers disagree with the [Funnel](/bi/reporting/charts/funnel) beside it | The two count different things | A funnel counts who is in a stage now; a lifecycle counts who ever reached it. |
## Related
* [Funnel](/bi/reporting/charts/funnel), the current headcount per stage.
* [Bars List](/bi/reporting/charts/bars-list), ranked counts per option.
* [Reporting overview](/bi/reporting/overview)
## Related topics
- [Use Cases](/start/use/overview.md)
- [Getting Started](/data/getting-started.md)
- [Automations](/automation/overview.md)
- [Introduction](/start/introduction.md)
- [Data Models](/data/models.md)
## When to use
A lifecycle chart answers three questions about one journey at once: how many records **reached** each stage, what share **converted** to the next one, and how long they **sat** in each. Use it for a sales pipeline, an onboarding path, a support queue, or a customer lifecycle — anywhere the stages have an order and you want to know where things stall.
It differs from a [Funnel](/bi/reporting/charts/funnel) in what it counts. A funnel counts the records sitting in each stage **right now**. A lifecycle chart reads each record's stage history, so a record that has moved on to Won still counts as having passed through Demo — which is what makes a conversion rate and a time-in-stage possible.
## Required data shape
* **Stage**: a Select or Status property whose options are in the order records move through them. The chart reads the options' own order.
* **History**: nothing to set up. Every stage change is recorded automatically from the moment the property exists.
## Configuration
| Setting | What it does |
| -------------- | -------------------------------------------------------------------------------------------------------------- |
| Object | The records whose journey you are measuring. |
| Stage property | The Select or Status property whose options are the stages. |
| Entered in | Which records to count, by when they first entered the journey: the last 30, 90, 180 or 365 days, or all time. |
## How to read it
* **The number above each bar** is how many records reached that stage, including any that skipped it on the way past. Because of that, reach never increases from one stage to the next and a conversion rate can never exceed 100%.
* **The darker foot of each bar** is how many records are sitting in that stage now.
* **The percentage between two bars** is the share of the left stage's records that went on to reach the right one.
* **The clock under each stage** is the time records spent there, counting only stays that have ended. Switch between **Median** and **Average** in the top right; median is the better default, since one abandoned record can drag an average a long way.
* **Slowest stage** names the non-final stage with the longest median stay. It is the first place to look when the full cycle is longer than you want.
* **Click any bar** to open the records sitting in that stage.
## Exit stages
A stage whose name reads as an exit — **Lost**, **Churned**, **Disqualified**, **Cancelled**, **Rejected**, **Dead** — is not drawn as a stage of its own. A record that ends there simply stops at the last real stage it reached, which lowers the conversion out of that stage.
This is what stops a pipeline ending "… Won, Lost" from counting every lost deal as having passed through Won.
## Limitations
* **It starts when stage history does.** Records that stopped moving before the stage property existed have no history to read, so an older workspace's earliest records are absent from the time and conversion figures.
* **Time in stage ignores records that are still there.** A record that has sat in Proposal for ninety days and not moved contributes nothing to Proposal's time until it does. The count of records in that stage still shows it.
* **A filtered chart reads at most 10,000 matching records.** Unfiltered, there is no cap.
* **It needs an ordered property.** The stages are drawn in the option order of the property itself, so reordering the options reorders the chart.
## Troubleshooting
| Symptom | Likely cause | What to check |
| ------------------------------------------------------------------------- | ----------------------------------------------- | ----------------------------------------------------------------------------------------------------------------------------------------- |
| "Pick a status or select property to see its stages." | No stage property is set | Open the block's settings and choose a Select or Status property. |
| A stage shows a dash instead of a time | No record has finished a stay there yet | Expected on a final stage, and on any stage whose records are all still in it. |
| Conversion looks too high between two stages | Records are skipping the stage in between | Expected — a skipped stage still counts as reached, so the journey stays honest. Check the stage order on the property if it looks wrong. |
| A Lost or Churned stage is missing | It is treated as an exit | Expected. It lowers conversion out of the previous stage instead of being drawn. |
| The chart is empty with records in view | No record entered the journey inside the window | Widen **Entered in**, or set it to All time. |
| Numbers disagree with the [Funnel](/bi/reporting/charts/funnel) beside it | The two count different things | A funnel counts who is in a stage now; a lifecycle counts who ever reached it. |
## Related
* [Funnel](/bi/reporting/charts/funnel), the current headcount per stage.
* [Bars List](/bi/reporting/charts/bars-list), ranked counts per option.
* [Reporting overview](/bi/reporting/overview)
## Related topics
- [Use Cases](/start/use/overview.md)
- [Getting Started](/data/getting-started.md)
- [Automations](/automation/overview.md)
- [Introduction](/start/introduction.md)
- [Data Models](/data/models.md)