> ## Documentation Index
> Fetch the complete documentation index at: https://docs.custral.com/llms.txt
> Use this file to discover all available pages before exploring further.
# Radial Bar Chart
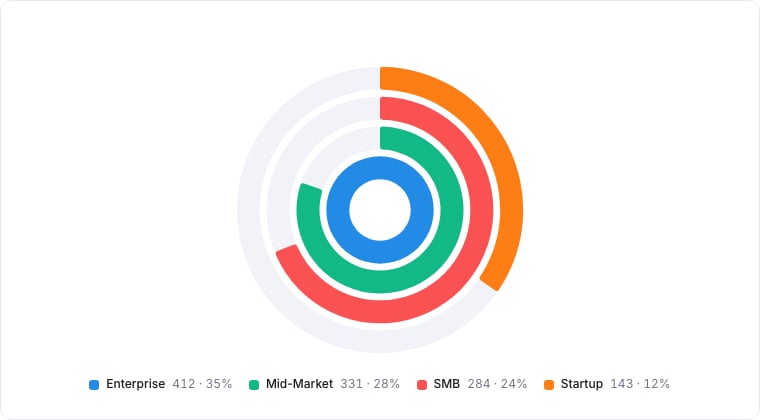
> Bars wrapped around a circular axis.
 ## When to use
Radial bars are a spatial alternative to a regular Bar chart, useful when you want a visually striking comparison of a small number of categories, typically a goal-tracking dashboard tile.
## Required data shape
* **Group**: categorical property.
* **Value**: numeric property; aggregated per group.
## Configuration
| Setting | What it does |
| --------- | ------------------------------------------------------------------------- |
| Group by | The property whose values become the rings. |
| Value | The numeric value aggregated per ring. |
| Max value | An optional ceiling for the outer ring's scale. Useful for goal tracking. |
## Limitations
* Effective with 3-6 categories.
* Less precise than a regular Bar chart; use it for impressionistic dashboards rather than analysis.
## Related topics
- [Bar Chart](/bi/reporting/charts/bar.md)
- [Chart drill-down](/bi/reporting/drill-down.md)
- [Reporting](/bi/reporting/overview.md)
- [Bars List](/bi/reporting/charts/bars-list.md)
- [Composite Chart](/bi/reporting/charts/composite.md)
## When to use
Radial bars are a spatial alternative to a regular Bar chart, useful when you want a visually striking comparison of a small number of categories, typically a goal-tracking dashboard tile.
## Required data shape
* **Group**: categorical property.
* **Value**: numeric property; aggregated per group.
## Configuration
| Setting | What it does |
| --------- | ------------------------------------------------------------------------- |
| Group by | The property whose values become the rings. |
| Value | The numeric value aggregated per ring. |
| Max value | An optional ceiling for the outer ring's scale. Useful for goal tracking. |
## Limitations
* Effective with 3-6 categories.
* Less precise than a regular Bar chart; use it for impressionistic dashboards rather than analysis.
## Related topics
- [Bar Chart](/bi/reporting/charts/bar.md)
- [Chart drill-down](/bi/reporting/drill-down.md)
- [Reporting](/bi/reporting/overview.md)
- [Bars List](/bi/reporting/charts/bars-list.md)
- [Composite Chart](/bi/reporting/charts/composite.md)