> ## Documentation Index
> Fetch the complete documentation index at: https://docs.custral.com/llms.txt
> Use this file to discover all available pages before exploring further.
# Sparkline
> Tiny inline trend with a headline number.
 ## When to use
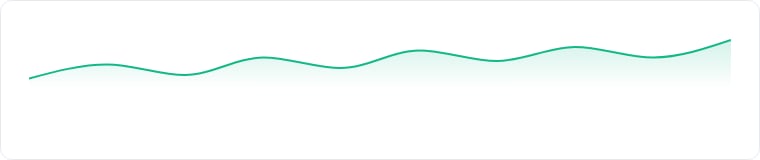
Sparklines are stripped-down trend lines designed to fit inside a card or dashboard tile alongside a big-number headline. Use them when the trend matters less than the current value, but you still want a one-glance sense of direction.
## Required data shape
* **X axis**: a date property.
* **Y axis**: a numeric or aggregated property.
## Configuration
| Setting | What it does |
| --------------- | --------------------------------------------------------------------------------- |
| X-axis | The date property plotted along the horizontal axis. |
| Y-axis | The numeric value (or aggregation) the line traces. |
| Time bucket | How dates are grouped: hour, day, or week. |
| Headline metric | The big number shown next to the line: current value, change (delta), or maximum. |
## Limitations
* No axis labels or grid by design, pair with the headline number for context.
* Bucket counts under \~6 produce a near-flat line; use a Line chart for short windows.
## Related topics
- [Stat card](/bi/reporting/stat-card.md)
- [Chart drill-down](/bi/reporting/drill-down.md)
- [Reporting](/bi/reporting/overview.md)
- [Build a sales pipeline](/recipes/sales-pipeline.md)
## When to use
Sparklines are stripped-down trend lines designed to fit inside a card or dashboard tile alongside a big-number headline. Use them when the trend matters less than the current value, but you still want a one-glance sense of direction.
## Required data shape
* **X axis**: a date property.
* **Y axis**: a numeric or aggregated property.
## Configuration
| Setting | What it does |
| --------------- | --------------------------------------------------------------------------------- |
| X-axis | The date property plotted along the horizontal axis. |
| Y-axis | The numeric value (or aggregation) the line traces. |
| Time bucket | How dates are grouped: hour, day, or week. |
| Headline metric | The big number shown next to the line: current value, change (delta), or maximum. |
## Limitations
* No axis labels or grid by design, pair with the headline number for context.
* Bucket counts under \~6 produce a near-flat line; use a Line chart for short windows.
## Related topics
- [Stat card](/bi/reporting/stat-card.md)
- [Chart drill-down](/bi/reporting/drill-down.md)
- [Reporting](/bi/reporting/overview.md)
- [Build a sales pipeline](/recipes/sales-pipeline.md)