> ## Documentation Index
> Fetch the complete documentation index at: https://docs.custral.com/llms.txt
> Use this file to discover all available pages before exploring further.
# Treemap
> Share-of-whole as rectangles sized by value.
 ## When to use
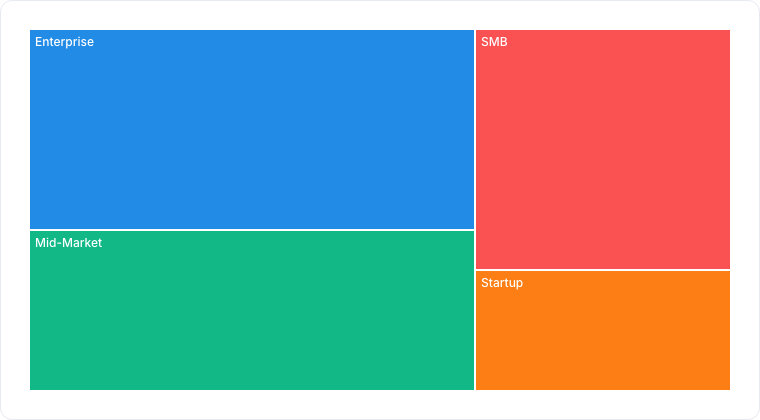
A treemap shows parts of a whole as packed rectangles, each sized by its value: revenue by product line, deals by stage, storage by team. It fits many categories into a fixed area, so it beats a [Pie](/bi/reporting/charts/pie) or [Donut](/bi/reporting/charts/donut) when you have more than a handful of categories but still want proportion at a glance.
## Required data shape
* **Group**: a categorical property whose values become the rectangles.
* **Value (optional)**: a numeric property aggregated per rectangle; defaults to a record count.
## Configuration
| Setting | What it does |
| ----------- | -------------------------------------------------- |
| Group by | The property whose values become the rectangles. |
| Aggregation | How each rectangle's value rolls up: Count or Sum. |
## Limitations
* Great for proportion, poor for precise comparison. Small rectangles are hard to read exactly. Use a [Bar chart](/bi/reporting/charts/bar) when exact values matter.
* Very high cardinality yields slivers too small to label; filter to the top categories.
## Troubleshooting
| Symptom | Likely cause | What to check |
| --------------------------------- | --------------------------------------------------- | ---------------------------------------------------------------- |
| One rectangle fills the whole map | One category dominates the total | Expected. Switch to Count, or filter it out to compare the rest. |
| Rectangles have no labels | Too many tiny categories | Reduce cardinality with a filter or a higher-level grouping. |
| The map is empty | No matching records, or the group property is unset | Check filters and that the property has values. |
## Related
* [Pie](/bi/reporting/charts/pie) / [Donut](/bi/reporting/charts/donut), share-of-whole for a few categories.
* [Reporting overview](/bi/reporting/overview)
## Related topics
- [Chart drill-down](/bi/reporting/drill-down.md)
- [Reporting](/bi/reporting/overview.md)
## When to use
A treemap shows parts of a whole as packed rectangles, each sized by its value: revenue by product line, deals by stage, storage by team. It fits many categories into a fixed area, so it beats a [Pie](/bi/reporting/charts/pie) or [Donut](/bi/reporting/charts/donut) when you have more than a handful of categories but still want proportion at a glance.
## Required data shape
* **Group**: a categorical property whose values become the rectangles.
* **Value (optional)**: a numeric property aggregated per rectangle; defaults to a record count.
## Configuration
| Setting | What it does |
| ----------- | -------------------------------------------------- |
| Group by | The property whose values become the rectangles. |
| Aggregation | How each rectangle's value rolls up: Count or Sum. |
## Limitations
* Great for proportion, poor for precise comparison. Small rectangles are hard to read exactly. Use a [Bar chart](/bi/reporting/charts/bar) when exact values matter.
* Very high cardinality yields slivers too small to label; filter to the top categories.
## Troubleshooting
| Symptom | Likely cause | What to check |
| --------------------------------- | --------------------------------------------------- | ---------------------------------------------------------------- |
| One rectangle fills the whole map | One category dominates the total | Expected. Switch to Count, or filter it out to compare the rest. |
| Rectangles have no labels | Too many tiny categories | Reduce cardinality with a filter or a higher-level grouping. |
| The map is empty | No matching records, or the group property is unset | Check filters and that the property has values. |
## Related
* [Pie](/bi/reporting/charts/pie) / [Donut](/bi/reporting/charts/donut), share-of-whole for a few categories.
* [Reporting overview](/bi/reporting/overview)
## Related topics
- [Chart drill-down](/bi/reporting/drill-down.md)
- [Reporting](/bi/reporting/overview.md)