

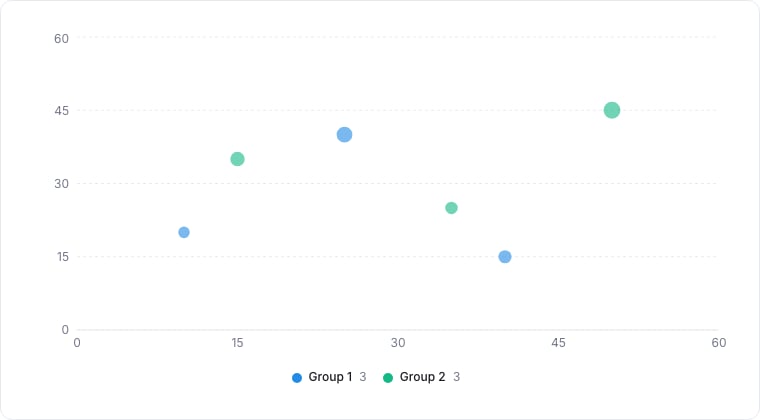
A bubble chart, scatter with a third value as point size.
When to use
A Bubble chart is a Scatter chart with a third dimension encoded as bubble size. Use it when you have three numeric metrics per record and want to spot outliers and clusters at a glance.Required data shape
- X axis: numeric property.
- Y axis: numeric property.
- Size: numeric property used as the bubble area.
Configuration
Limitations
- More than ~200 records becomes hard to read.
- Size mapping is by area, not radius, small differences in the underlying value look smaller than they really are.