

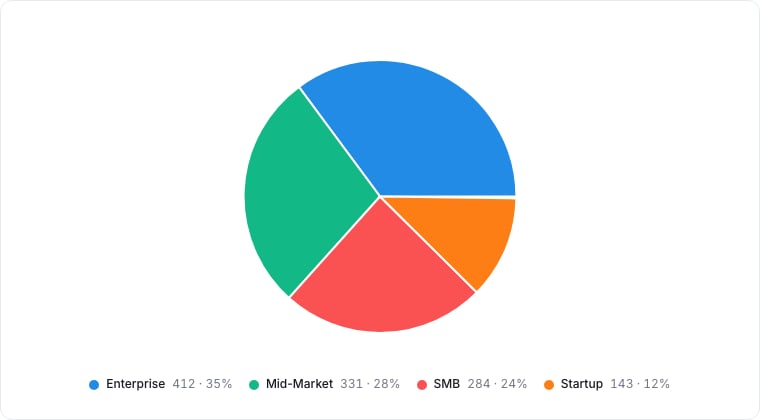
A pie chart broken down by segment.
When to use
Pie charts answer “what share of the total is X?”. The center is filled (no donut). Pick Pie over Donut when you don’t need the center for a headline metric.Required data shape
Same as Donut. A categorical group property and an optional aggregated value.Configuration
Limitations
- Five or fewer categories.
- Like Donut, pies are bad at communicating precise differences. For exact comparison, use Bar.