

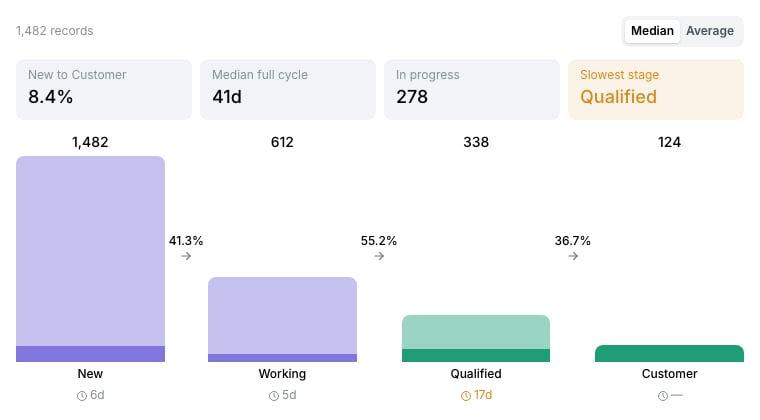
A lifecycle chart showing how many records reached each stage, the conversion between them, and the time spent in each.
When to use
A lifecycle chart answers three questions about one journey at once: how many records reached each stage, what share converted to the next one, and how long they sat in each. Use it for a sales pipeline, an onboarding path, a support queue, or a customer lifecycle — anywhere the stages have an order and you want to know where things stall. It differs from a Funnel in what it counts. A funnel counts the records sitting in each stage right now. A lifecycle chart reads each record’s stage history, so a record that has moved on to Won still counts as having passed through Demo — which is what makes a conversion rate and a time-in-stage possible.Required data shape
- Stage: a Select or Status property whose options are in the order records move through them. The chart reads the options’ own order.
- History: nothing to set up. Every stage change is recorded automatically from the moment the property exists.
Configuration
How to read it
- The number above each bar is how many records reached that stage, including any that skipped it on the way past. Because of that, reach never increases from one stage to the next and a conversion rate can never exceed 100%.
- The darker foot of each bar is how many records are sitting in that stage now.
- The percentage between two bars is the share of the left stage’s records that went on to reach the right one.
- The clock under each stage is the time records spent there, counting only stays that have ended. Switch between Median and Average in the top right; median is the better default, since one abandoned record can drag an average a long way.
- Slowest stage names the non-final stage with the longest median stay. It is the first place to look when the full cycle is longer than you want.
- Click any bar to open the records sitting in that stage.
Exit stages
A stage whose name reads as an exit — Lost, Churned, Disqualified, Cancelled, Rejected, Dead — is not drawn as a stage of its own. A record that ends there simply stops at the last real stage it reached, which lowers the conversion out of that stage. This is what stops a pipeline ending ”… Won, Lost” from counting every lost deal as having passed through Won.Limitations
- It starts when stage history does. Records that stopped moving before the stage property existed have no history to read, so an older workspace’s earliest records are absent from the time and conversion figures.
- Time in stage ignores records that are still there. A record that has sat in Proposal for ninety days and not moved contributes nothing to Proposal’s time until it does. The count of records in that stage still shows it.
- A filtered chart reads at most 10,000 matching records. Unfiltered, there is no cap.
- It needs an ordered property. The stages are drawn in the option order of the property itself, so reordering the options reorders the chart.
Troubleshooting
Related
- Funnel, the current headcount per stage.
- Bars List, ranked counts per option.
- Reporting overview