

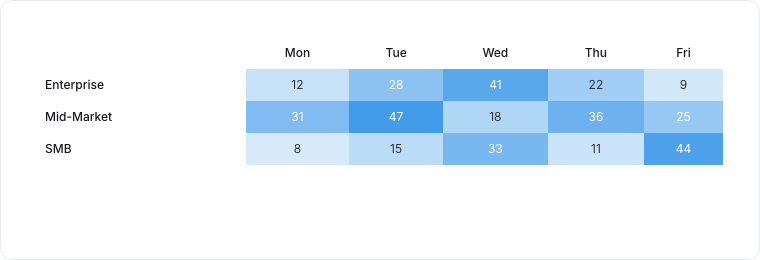
A heatmap showing value density across rows and columns.
When to use
Heatmaps reveal patterns across two categorical dimensions: hour-of-day vs day-of-week, channel vs disposition, sales rep vs deal stage. Color intensity encodes the value at each intersection.Required data shape
- Rows: a categorical property.
- Columns: a second categorical property.
- Value (optional): numeric property aggregated per cell; defaults to count.
Configuration
Limitations
- Best with bounded axes (24 hours, 7 days). Open-ended axes (record id) are not useful.
- Color scale defaults to linear; for highly skewed data, switch to log.